Published November 13, 2014
Commercial real estate lenders, borrowers, and CMBS investors alike are looking at the next three years as a true test of the strength of recovering capital markets. Property values have rebounded in many markets, interest rates are low, and foreign investment is boosting US properties in gateway cities. On the other hand, big box retailers continue to close stores at a rapid pace, big banks and law firms are cutting their office footprints, and new construction is slowing down multifamily appreciation. Rising rates and higher relative underwriting standards could lead to volatility both in CMBS prices and commercial real estate values just as more loans than ever before reach maturity.
CMBS issuance volumes were higher than ever in 2005, 2006, and 2007 with a peak volume of about $230 billion in 2007. The far majority of this issuance was made up of ten year balloon loans, creating a wall of maturities from 2015 to 2017. Over the next three years, more than $300 billion in Conduit CMBS loan balance will mature. That’s more than 2.5 times the amount that matured from 2012 to 2014.
Office and retail loans make up 63% of the loan balance maturing in the next three years with multifamily in third at 14%.
“Refinancability”
With 2014 issuance set to reach just below $100 billion and 2015 forecasts calling for a marginal increase, the CMBS origination engine will have to pick up the pace to digest the wall of maturities, especially in the heavy 2016 and 2017 years. Headwinds include the threat of rising rates, the end of quantitative easing, and the implementation of new risk retention regulations coming in January of 2017. Currently, multifamily and industrial have the highest rate of maturing delinquent or specially serviced loans at 12.4% and 12.0% respectively. Multifamily delinquency in 2016 maturities comes mainly from the $3 billion StuyTown loan which actually suffers more from risk of extension and litigation than of low valuation. The Schron Industrial Portfolio ($208.5 million) and Bush Terminal ($292.5 million) loans contribute to the high rates in 2015 and 2017 in the Industrial category.

Comparing debt yields, cap rates, LTVs, and DSCRs of loans originated so far this year with those coming due gives us an idea of how easily borrowers will be able to refinance or sell their properties when their balloon payment arrives. Below is a comparison of all conduit loans originated so far in 2014 and the loans coming due in the next three years. Cap rates on average have been lower on new issuance than what’s coming due while DSCR on new loans is significantly higher than those coming due. Maturing loan LTV ratios are also higher than what the average lender is doing this year especially in loans coming due in 2016 and 2017. Debt yields on maturing loans are generally lower than what lenders are requiring on new loans so far this year. Highlighted cells show where maturing debt yields, cap rates, and DSCR are lower than current origination as well as where LTV is higher.
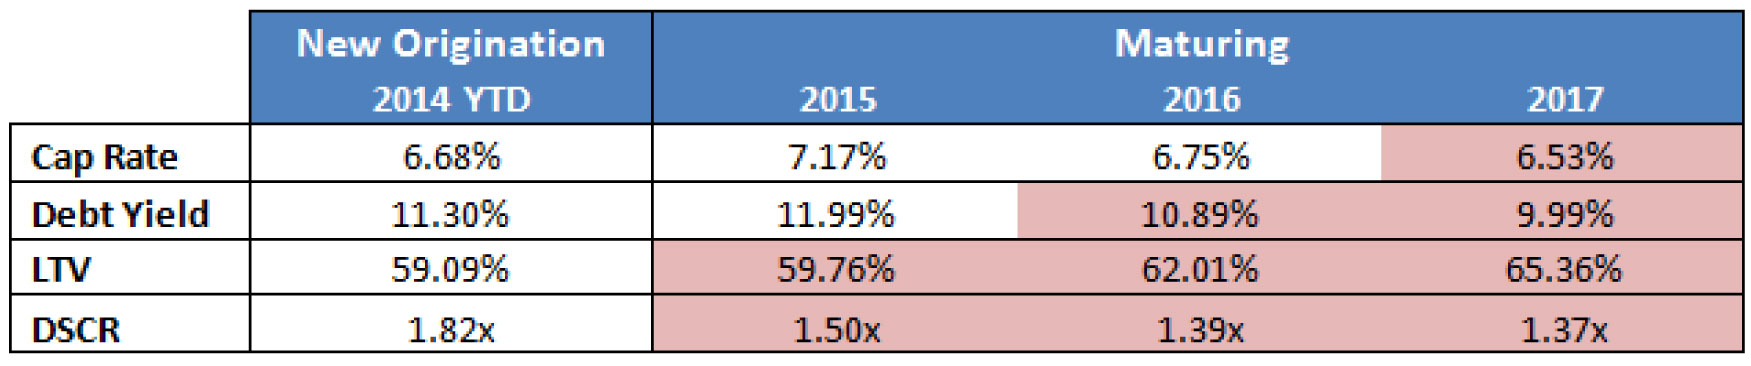
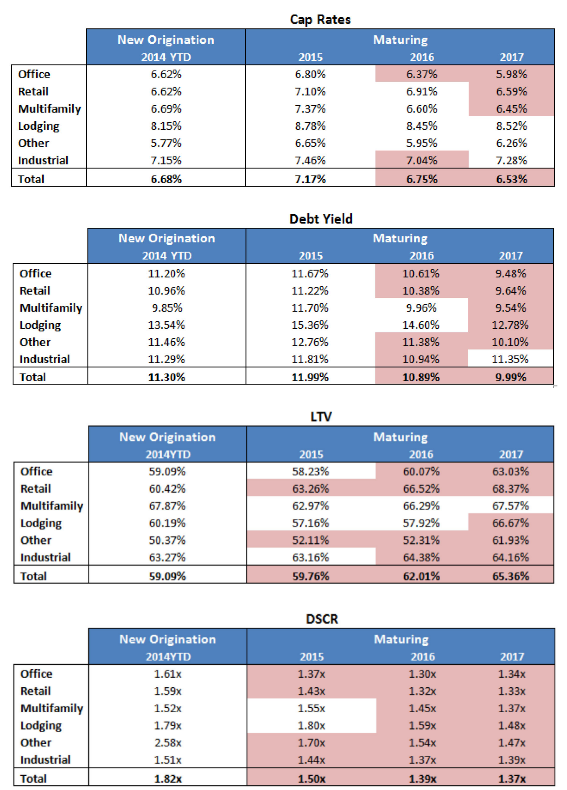
For further detail, we break out these measures by property type to find pockets of opportunity for originators to find value in maturing loans as well as sectors where additional capital will be necessary.
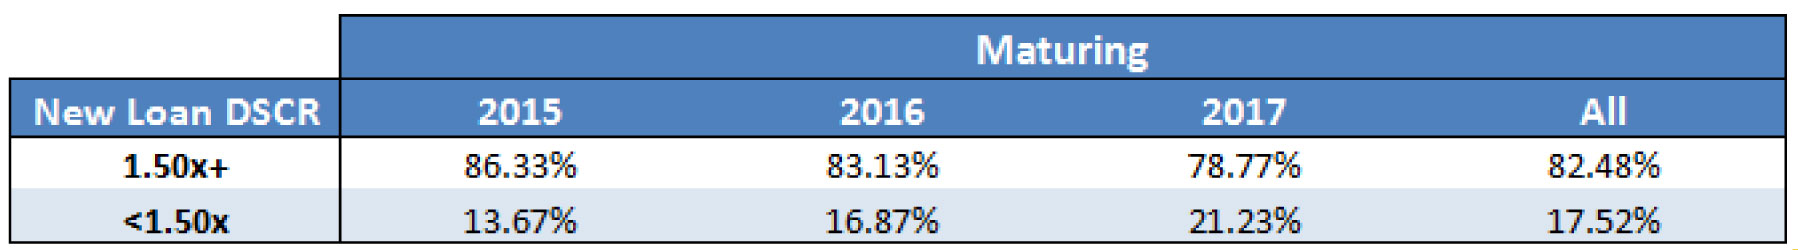
So far in 2014, new loan interest rates average 4.94% for all property types with a high of 5.08% in lodging and a low of 4.89% in office. Doing a simple analysis of maturing loans, applying a 5% interest only payment to current loan balances and looking at current Net Cash Flow measures gives a rough estimate of what DSCRs on a refinance loan might be. Assuming lenders require at least a 1.50x DSCR on new loans, 82% of loans maturing between 2015 and 2017 would be eligible for refinance at current debt and income levels. Loans maturing in 2015 have the highest percentage of loans at or above the threshold while 2017 maturities are the lowest.
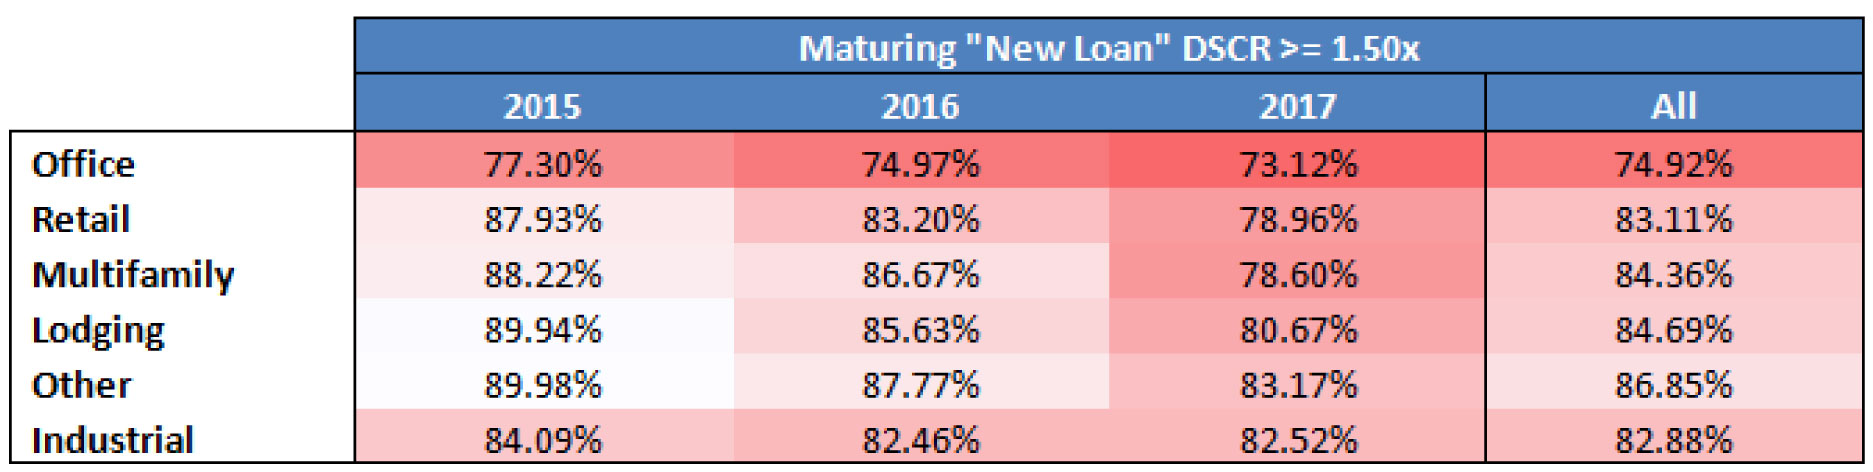
Breaking down hypothetical “new loans” by property type shows office properties will have the hardest time refinancing at current debt and income levels and all property types get worse moving into 2017.
Going Forward
Looking ahead, the wall of maturities presents an opportunity for originators and a worry for legacy CMBS bondholders. In 2012, a mini-wave of maturities resulting from 5 year loans done in 2007 sent the Trepp delinquency rate to its highest level of all time. Maturing volume that year was 40% of what it will be in both 2016 and 2017. With nearly 60% of the entire CMBS public conduit universe maturing in the next three years, property transaction and origination volumes will have to continue and accelerate their upward trends. Almost 20% of those maturities will also require additional capital either from current borrowers or new buyers when the loan is refinanced or the property is sold. All of this will have to happen in an environment of uncertainty in terms of interest rates, property values, and a shifting landscape in office and retail property usage. CMBS investors are well aware of the risks inherent in the wall of maturities, the question is what will the economy look like in six months, in a year, in two years when the brunt of this wave is set to hit the CRE market. Lower for longer interest rates, continued property value appreciation, and fundamental performance growth would make the wall much easier to scale.