Will Cap rates rise in 2017?

Interest rates have begun to rise and according to the Federal Reserve are expected to continue throughout 2017. How will this change forecasted domestic and foreign CRE investment and will cap rates increase in response to interest rates.
According to Spencer Levy head of research at CBRE, China’s weaker capital investment is expected however German and Japanese investors will be increasingly seeking higher yields with near zero rates domestically. In 2016 most domestic and foreign investors sought property in secondary markets for extra yield and this is expected to continue in 2017 but there is concern if this market is “liquid” enough and if it has enough products to fill demand.
Continued uncertainty of government policy with the Federal Reserve increasing short term rates could move buyers and sellers apart. Throughout 2016 the cap risk premium has narrowed according to Ryan Severino chief economist with CRE services firm JLL. This resulted in little movement in Cap Rates but risk premium margins suffered. If there is clear direction in policy a sense of urgency with buyers and sellers will continue and cap rates could remain flat.
Remember we have not had cap rates this low. When short term rates rise from 50 basis points to 1.5% versus historically when they rose from say 5% to 6%, the percentage increase in the first instance is 200% while in the second instance is only 20%. Leverage transactions will reflect LIBOR changes and spreads will move as extended terms are requested. Once rates rise, these leverage investors may experience sale or refinancing shock.
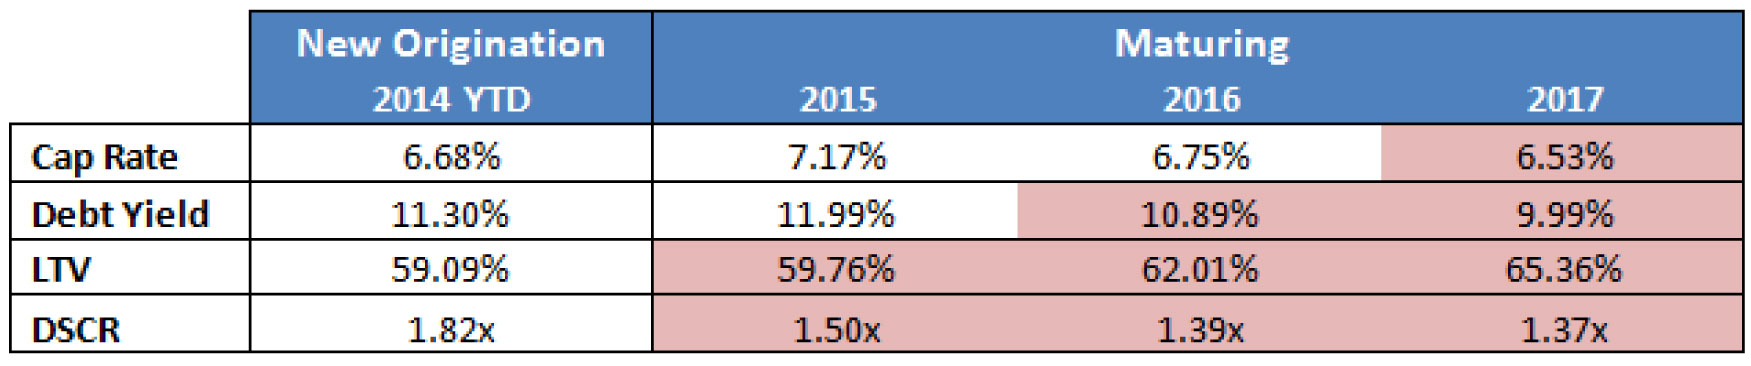
It is important to remember many items can determine Cap Rates (most notably NOI) but a pure mathematical table is below:
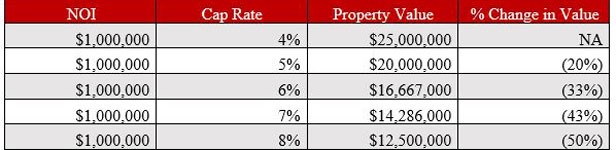
As shown in the table, if Cap Rates increase by 2% from 4% at acquisition to 6% at sale, the value of the property will decline by 33% (excluding any NOI increases for presentation purposes). If the increase in Cap Rates is more severe, going from 4% to 8%, then values decline by 50%. Approximately 70% of the IRR on a CRE investment derives from the sale or terminal value and the Cap Rate expansion shown above may negatively affect internal rates of return.
REIT activity supports the concern of Cap Rates. Much of REITS total return is based on sale of the asset to continue to distribute their IIR. According to Commercial Property Executive REIT acquisitions were down 35% and dispositions were up 31% and the highest annual figure in industry history. It appears the REIT industry are “taking advantage of high prices (low Cap Rates expected to go higher) to shed non-core assets in primary markets”.
Even if NOI increases 3% to 4% per year from robust rent growth the investor has tremendous terminal value Cap Rate risk. According to the Mortgage Bankers Association 2017 CRE loan originations are expected to increase 3% over 2016 and be a record year at $515 billion. Expect banks to tighten underwriting at the direction of the regulators, CMBS volume to down again this year and GSE to have another record year of originations. All lenders will increase focus on repayment cash flows with initial increasing interest rates.
Be cautious. We may live off “spread” but pushed by rising short term interest rates and demand for higher current yield from all investors Cap Rates may move upward and prices downward.

 In spite of the concerns above the underlying demand drivers of job growth, consistent retail sales growth and strong demographic trends are encouraging commercial real estate investments. Vacancies have tightened for all property types and in most markets demand has outstripped new supply. Resulting increasing rent growth will remain a positive driver as investors consider future yields. This will result in increasing transaction activity supported by increasing debt throughout 2016.